Pricing Opportunities
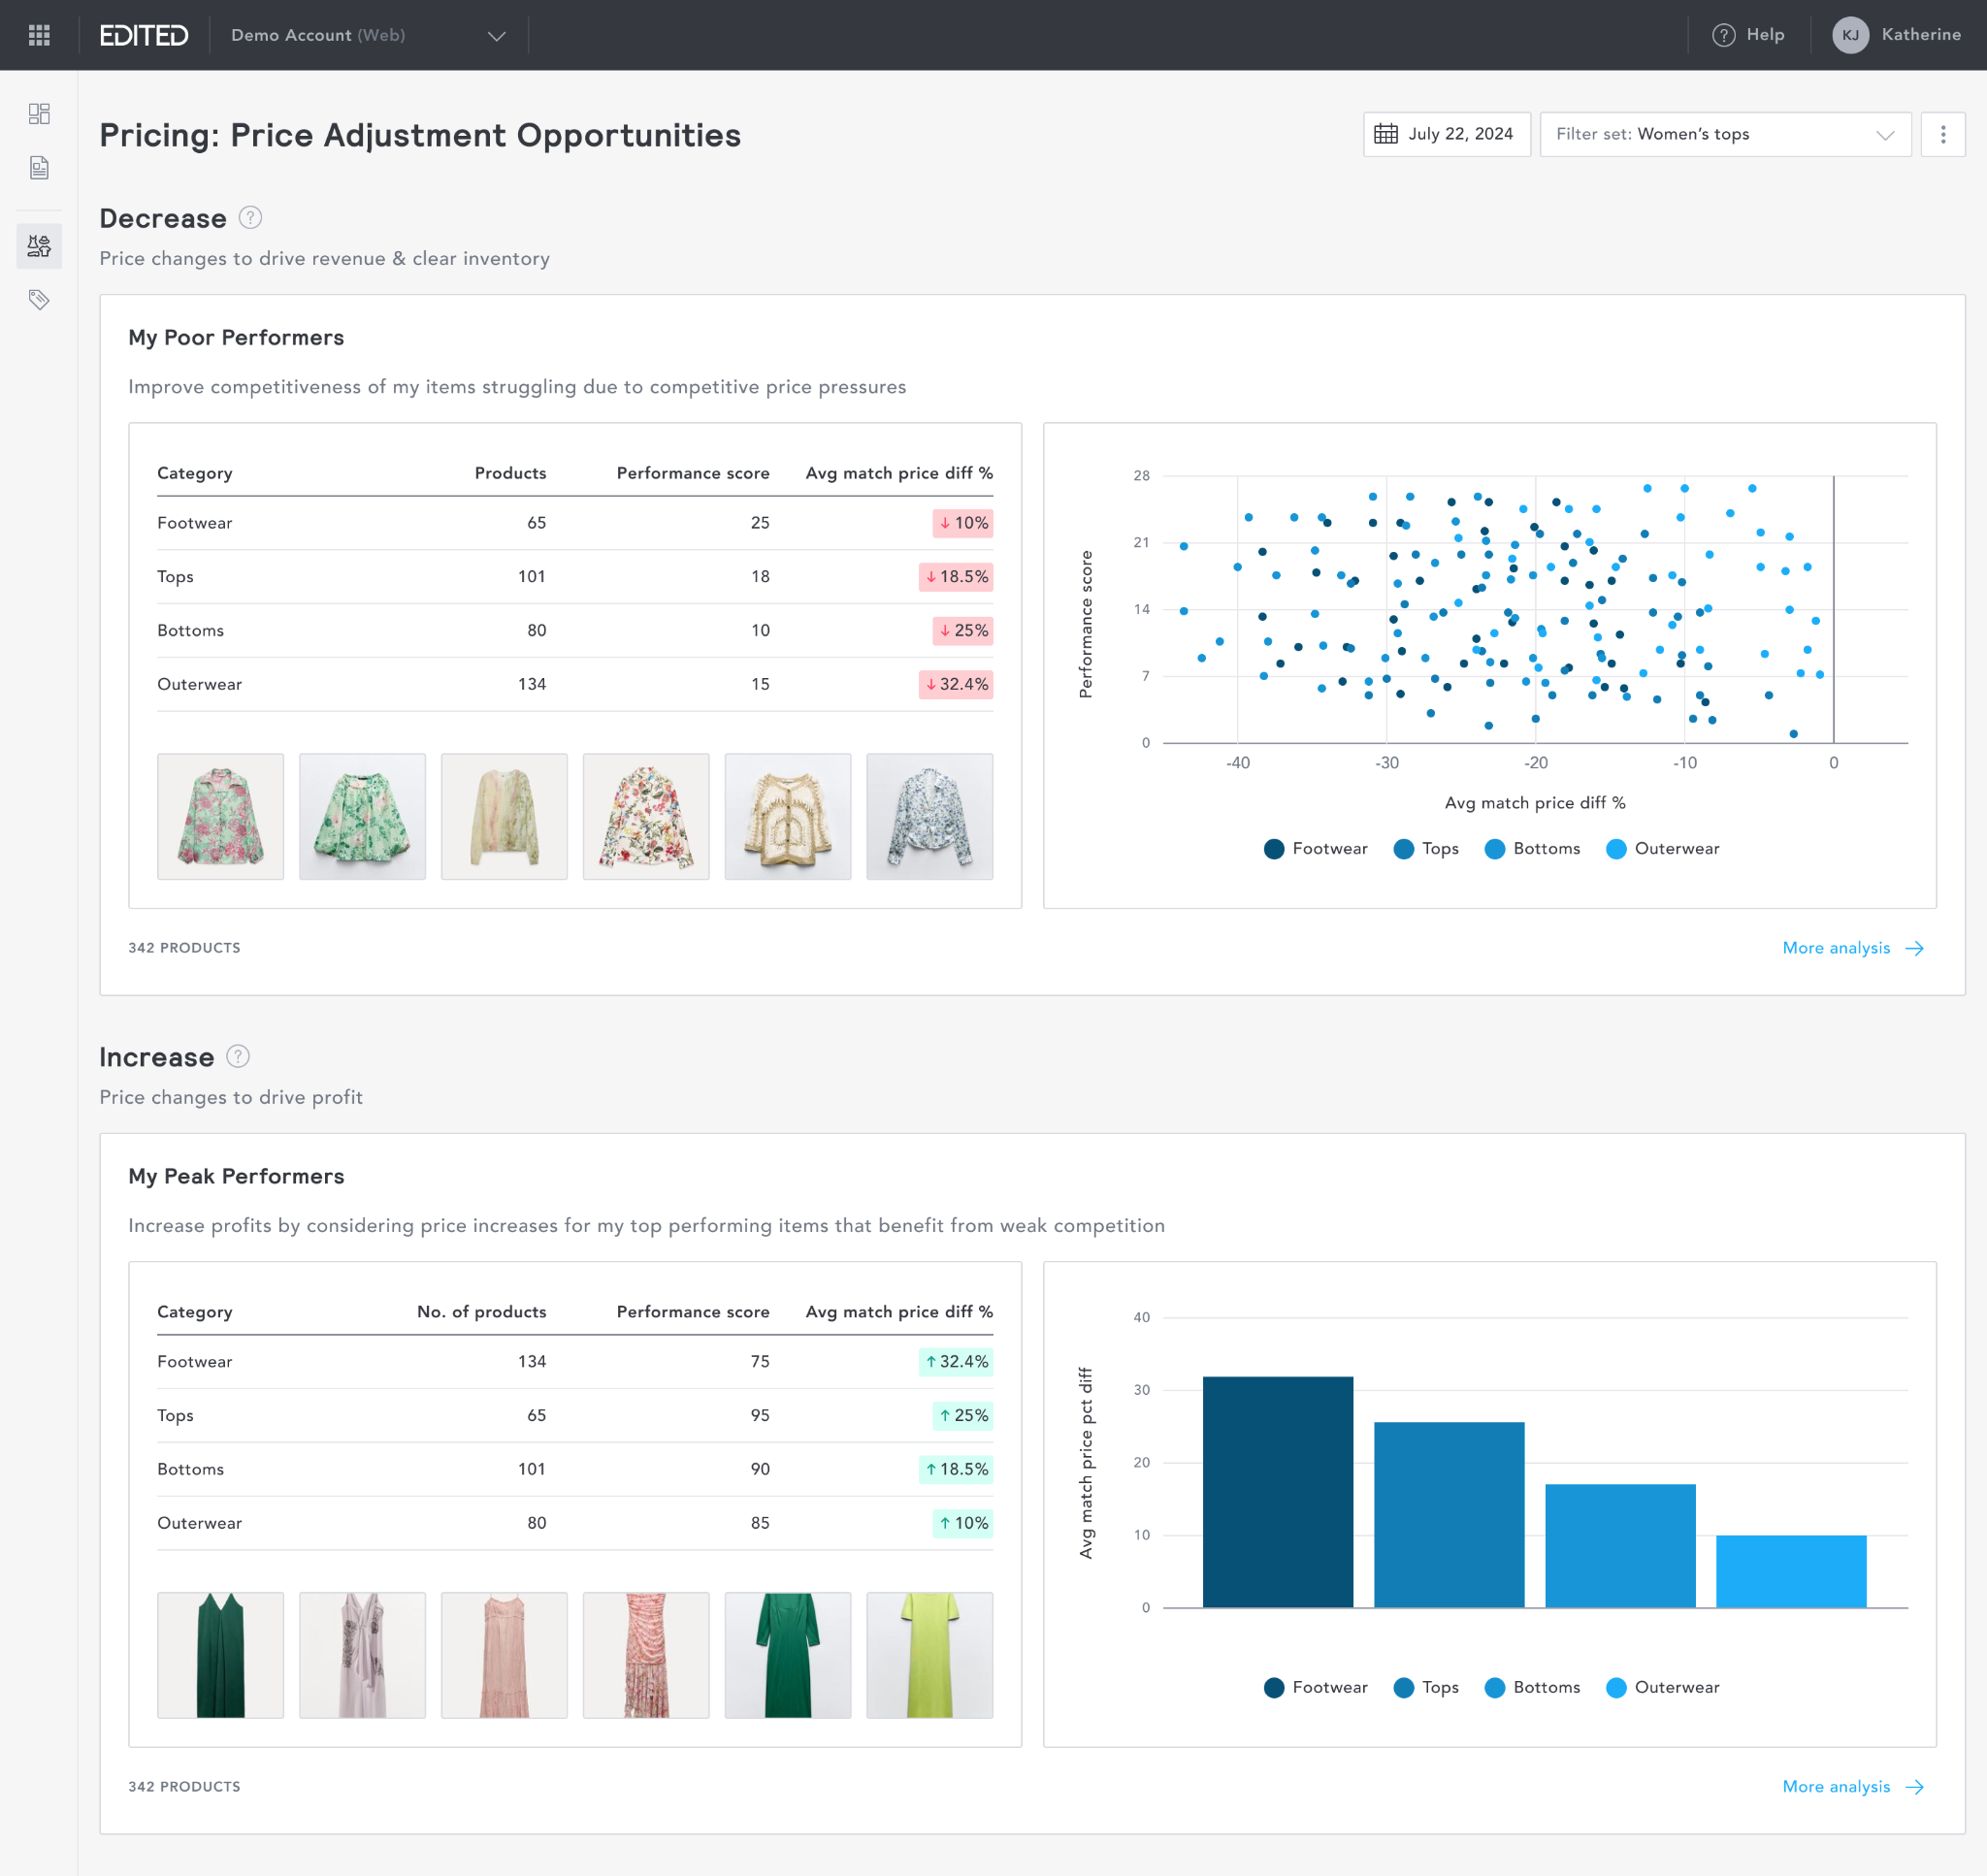
EDITED uses AI to automatically identify products to consider for a price increase or decrease.
Competitive Analysis
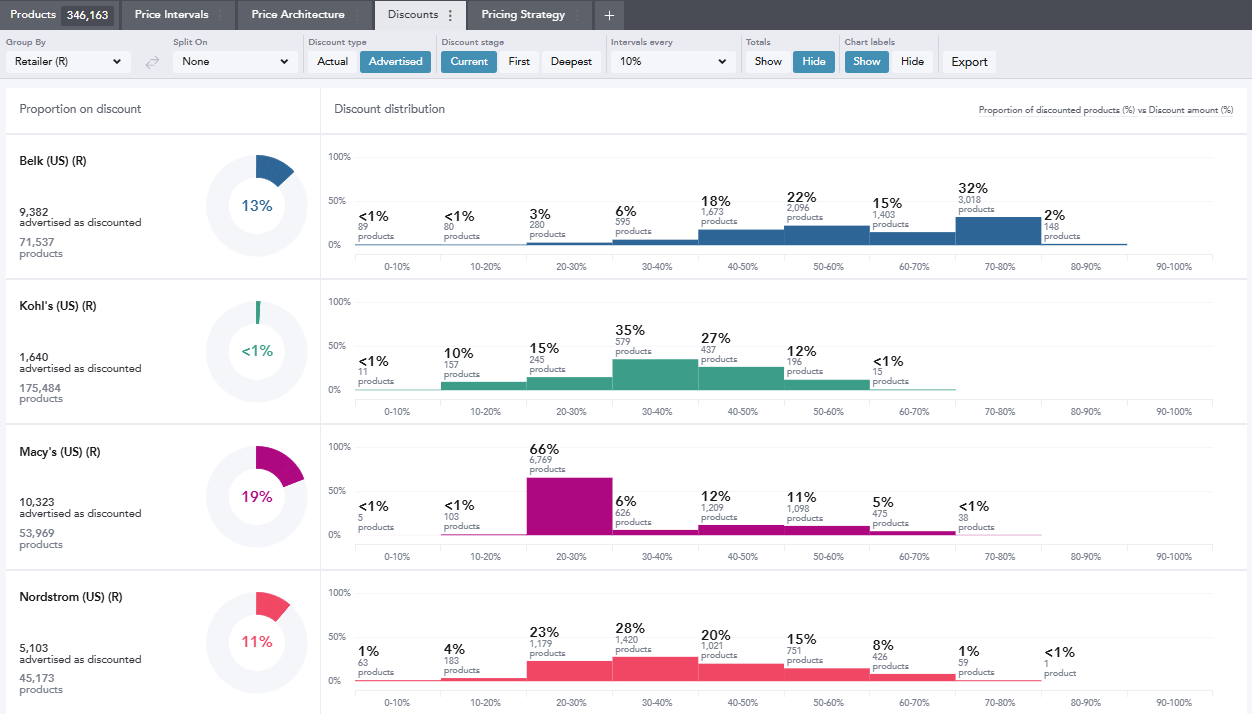
Competitor pricing analysis tools let you visualize and benchmark yourself against competitors' products by price point, pricing architecture, discount depth, and pricing mix.
Performance Analysis
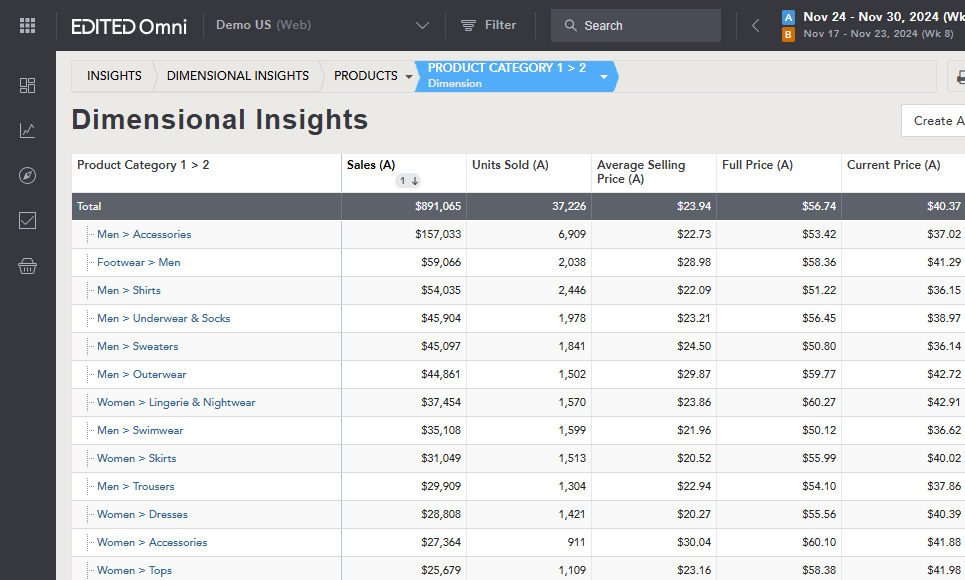
Gain insights into your own pricing strategies with tools that analyze your product performance, product profitability, promotion performance, and customer profitability.
Pricing Automation
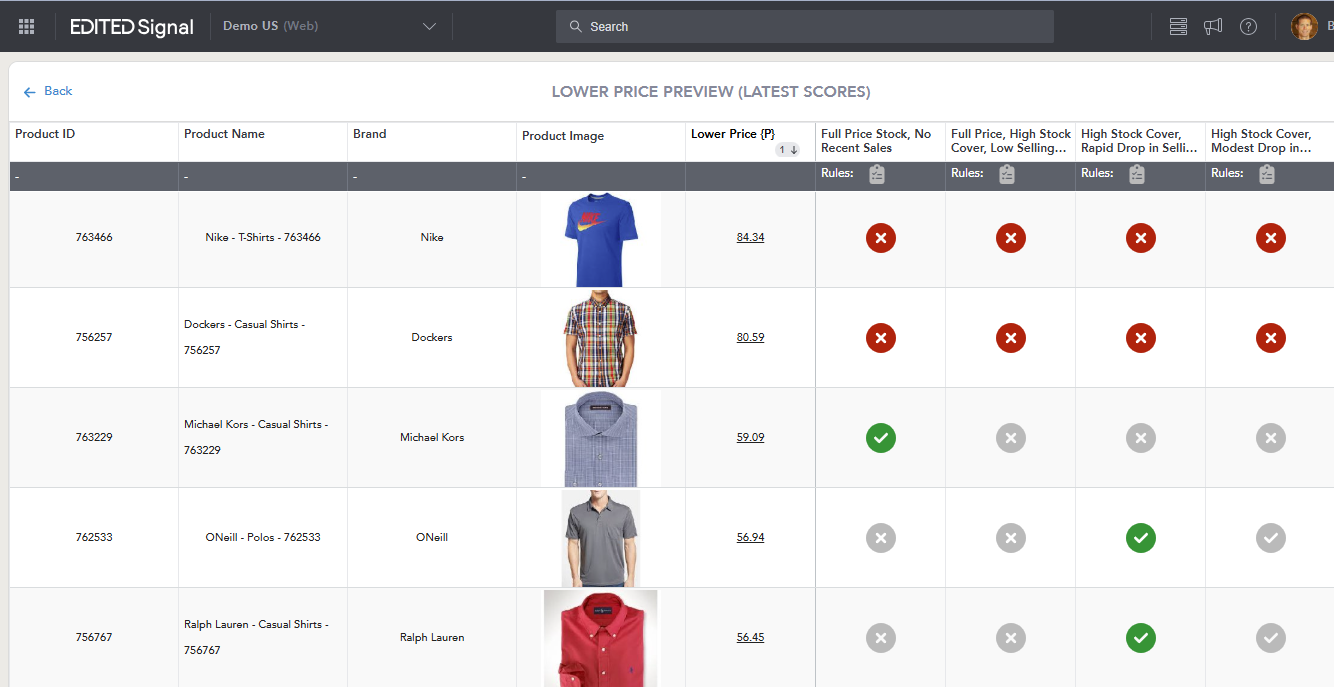
With AI pricing tools, you can automate price changes based on multiple rules, such as margin, stock status, and low conversion.


