Key Takeaways
- Validate at every commitment point,
- Carry your trend direction through
- T-120 and T-45 are your highest-value checkpoints: that’s when price, depth and markdown are set.
- Bring a position, an owner and a date to meetings that already happen.
Usage vs Utilization
Retail data utilization is the share of decisions in your buying and trading calendar that use market data at the moment they’re made. It isn’t logins, reports run or seats bought. A team can use a retail intelligence platform every day and still make range, price and markdown calls without market context. The goal is to pair instinct with market context at every decision. As Bain puts it in its work on merchandising and agentic AI: “The problem is not data access but the capacity to fully understand it.”
Training raises usage. Only changing where intelligence sits in the process raises utilization.
Building on What You Already Do
Most teams already validate their season frame and trend direction against the market. That’s a strong foundation. The opportunity is to carry the same confidence through to the decisions that follow: range shape, price, depth and in-season moves.
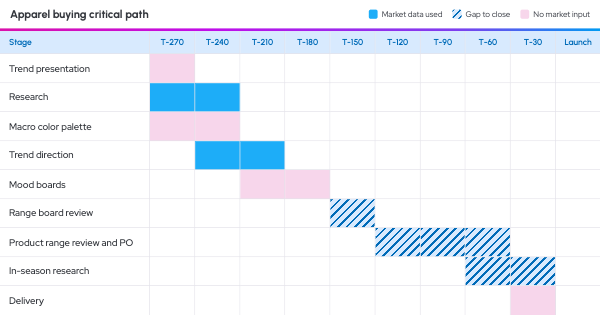
One enterprise apparel retailer mapped its nine-stage buying process and found market data supporting two of them: external research and trend direction. Extending that to five would put market context behind every decision that commits budget.
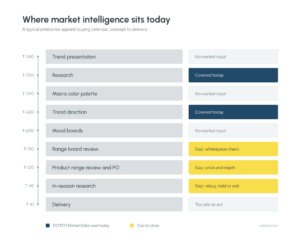
Today: market data supports two stages, both in early planning.
T is launch day, so T-120 means 120 days before launch. If your calendar counts from a different date, see the FAQ below.
The season’s direction is set at T-220. Carrying that market view through to T-120, when budget is committed, is where the biggest gains sit.
Your Validation Checkpoints
Validate at every stage where a decision gets locked in, from the season frame through to markdown. On a typical apparel calendar, that’s five checkpoints.
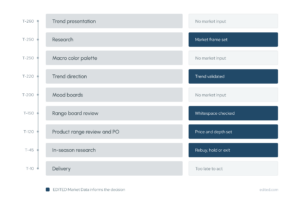
Target: market validation at five checkpoints.
| Stage |
Timing |
Question to validate |
What a confident decision looks like |
| Research |
T-250 |
Where is the category growing, and at what price? |
A season frame built on current market movement |
| Trend Direction |
T-220 |
Is this trend already selling, and how fast? |
Backing trends with proven sell-through |
| Range Board Review |
T-150 |
Where are the gaps and whitespace? |
A range shaped to win share, not mirror competitors |
| Product Range Review and PO |
T-120 |
Are our price, depth and margin right against the market? |
POs placed with competitor benchmarks in hand |
| In-Season Research |
T-45 |
Is the trend accelerating or fading? |
Rebuy, hold or markdown calls made ahead of competitors |
Making Market Data Usable in a Meeting
Don’t create a new meeting. Your range board review, trade meeting and pricing review already have an agenda, the right people in the room and the authority to decide. If your analysis doesn’t fit on one slide in one of those meetings, it’s reading material, not an input.
Then change what the output says. “Competitor depth in outerwear is up 18% year on year” is a finding, and findings lead to more questions. “The market is investing in outerwear, so holding our depth protects share where demand is growing” is a position, and positions lead to decisions.
Finally, write the owner and the decision date into the document itself. An owned insight becomes a decision.
What to Look for in a Platform
Three things decide whether a platform gets used at the moments that matter.
- Answers in the room. If a question in a range review takes three hours to answer, it becomes an action point and the decision slips a week. If it takes seconds, it’s settled before the meeting ends.
Eva Novorolnikova, a Pricing Analyst at Harrods, described exactly this: her manager asked a question mid-meeting, and she pulled the analysis and answered before the conversation moved on.
- No superuser needed. If only one analyst can use the tool, market data only reaches the meetings that analyst attends. With AskEDITED, any buyer, merchant or planner can type a question like “How has competitor depth in outerwear changed since last season?” and get charts and product examples back.
- Works in the tools your team already uses. Through MCP, EDITED data can appear inside Claude, ChatGPT or Copilot, or feed into your planning system, next to your own sales and stock figures. Your internal data stays in your own environment.
All of this depends on clean data underneath. EDITED has over 15 years of normalized retail data, covering more than 8Bn SKUs from 600K+ brands and 4K+ retailers in over 100 countries.
When every checkpoint has market context, decisions get faster, debates get shorter, and the range that lands in store is one the whole team can stand behind. Book a demo with one of our retail AI experts to see AskEDITED and our MCP in action, and get a free AskEDITED trial.
Frequently Asked Questions
What Does T-120 Mean in a Retail Buying Calendar?
T is the launch date, when product goes on sale, and days are counted back from it. So T-120 is 120 days before launch, and T-250 is about eight months before. Apparel teams use this because it works for any season. Some businesses count back from intake or supplier handover instead, and faster categories like grocery and beauty use much smaller numbers.
What’s the Difference Between Retail Intelligence and Trend Forecasting?
Trend forecasting is qualitative and looks two or more seasons ahead. Retail intelligence is quantitative and current: what’s on sale now, at what price, in what depth, and how fast it’s moving. Most retailers use both, with market data checking what the forecast suggests. Several EDITED customers use it this way alongside WGSN.
How Do You Measure ROI on a Retail Intelligence Platform?
Start with time saved. The Monday trade report typically takes around three hours to pull together, and EDITED Workflows cuts that to about three minutes. McKinsey estimated in January 2026 that merchants could get back up to 40% of their time by handing manual tasks to AI agents. After that, track decisions with a margin figure attached, such as SKUs priced above the competitor average.